Covid Tracker
ECE5725 Final Project report
By Suhui Yu, Yanan Liu.
Demonstration Video
Introduction
Since the outbreak of the new coronavirus pneumonia in 2019, the disease has spread globally, and the epidemic has continued to the present, and the disease has become an epidemic with the largest number of deaths in human history. For a long time, people have been paying attention to the data of the new crown epidemic in various places. Our project is to use web crawlers to crawl the epidemic data on the website, and visualize the crawled data and display it on piTFT. We use python to implement a web crawler, select the webpage with the data we are interested in as the target webpage, crawl the data on the webpage every hour, and store it locally. Further read the data to generate maps and tables for visualization.

Project Objective:
- Realize that the web crawler crawls the data of the target website hourly, generates a CSV file, and stores it locally.
- Read local data, realize data visualization to generate maps and tables
- Pygame display
Design
1.Crawler
First, we filter the target webpage based on the information we want to obtain, and the webpage we decide to grab data is Worldometers.
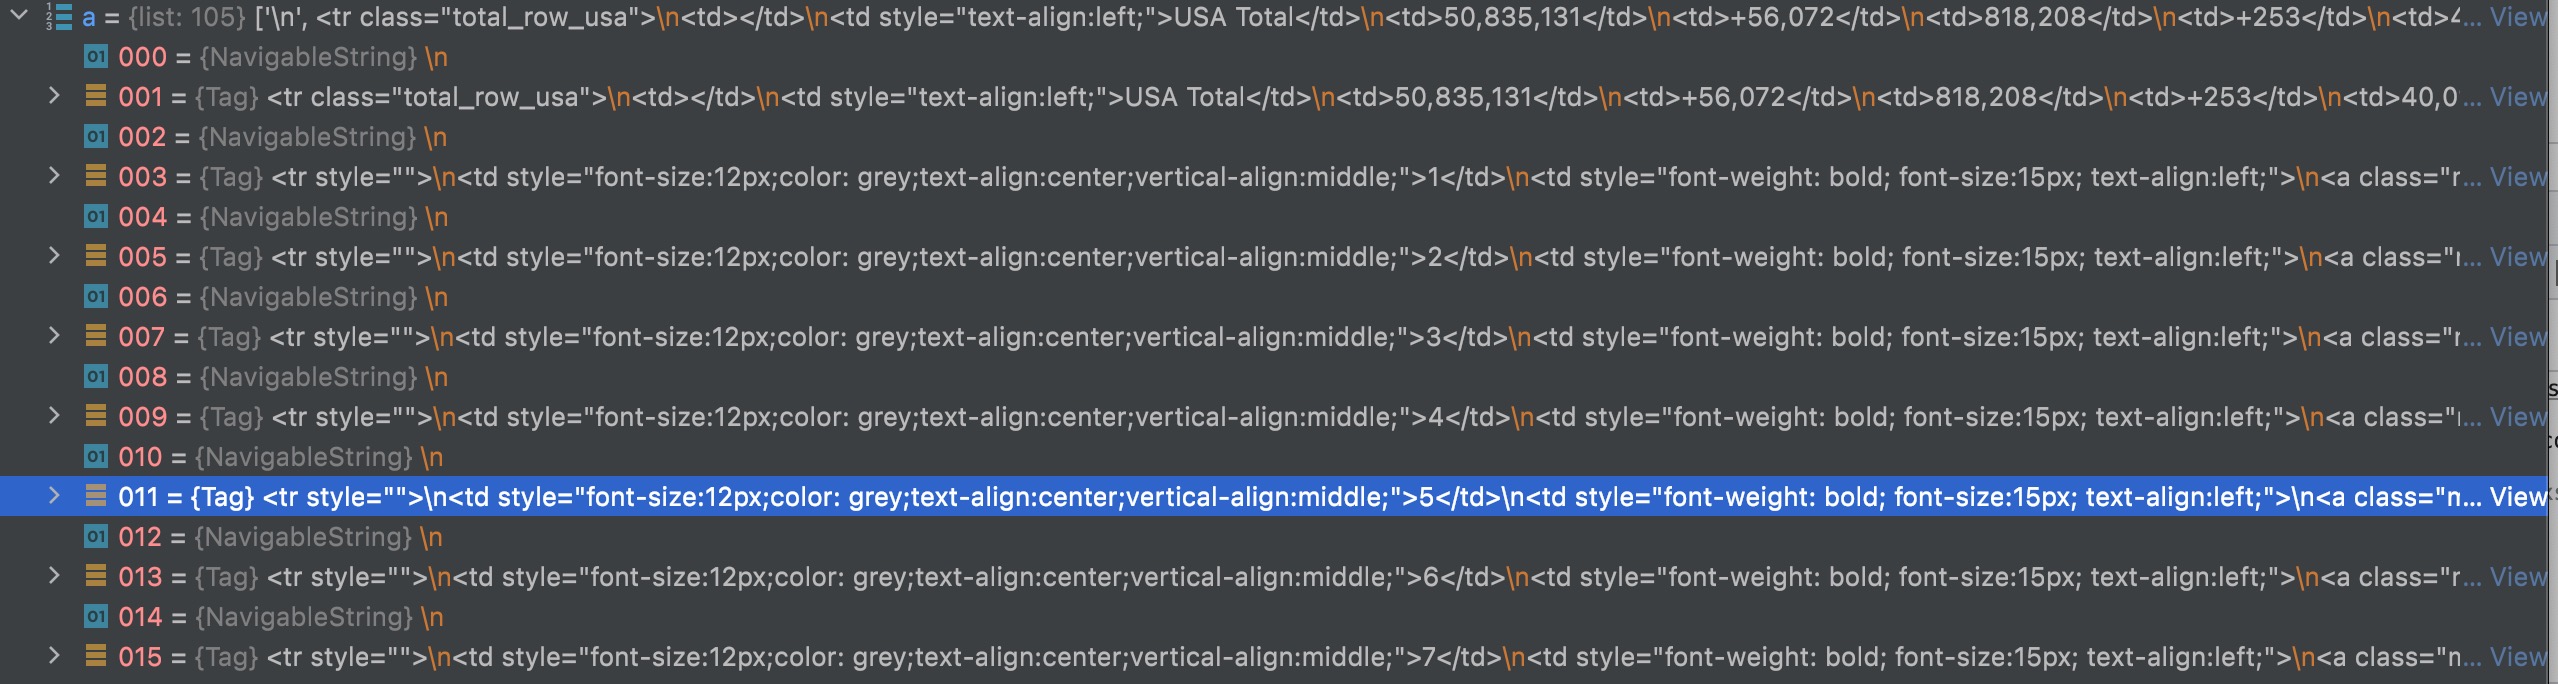
Using the web developer mode we can get the HTML of the web page to analyze, and then find the HTML module corresponding to the data part in the web page. In this project, the id of the module corresponding to the data we want to obtain is usa_table_countries_today. We can further analyze this module in more depth. The title of the main body of this table is tbody, the title of each row is tr, each row is the data of each state, and the title of each column in each tr is td, corresponding to each Different data for each state, such as the number of new cases, the number of new deaths, etc.
In the code, we use the python library Beautiful Soup to parse the target webpage and obtain the content of the corresponding data. Note that when we get the tbody to the data content, she will act as a navigable string with an even number, and a html code with a odd number. We only need to get the odd rows of data, generate a dictionary for each state's data, add it to the list, and finally add the list to the list. Converted to a CSV file, named with the current date.
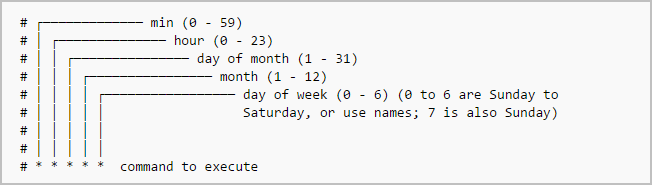
In order to make the crawler program get the data hourly automatically, we use the cron tool, a kind of time-based task management system, to help us to achieve it. It based on the command in the cron table(crontab), which help us to create and edit the cron file and the specific command to use the cron table is "crontab -e". And then we can add the cron command need to be executed. Examples of instructions and the meaning of each element are as follows.
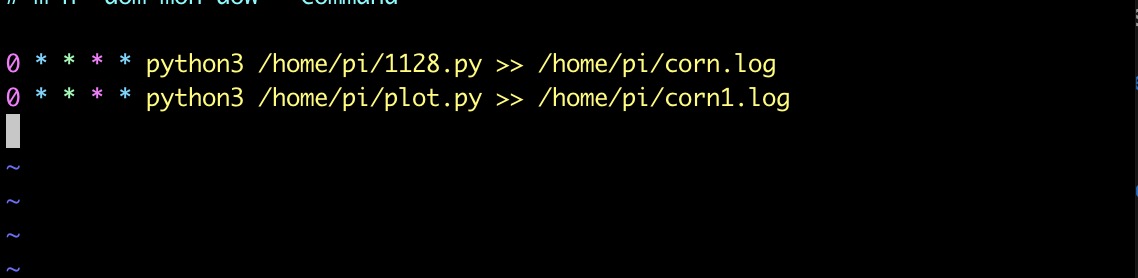
Our command is as follows to run the crawler program and data visualization program hourly and store the result in log file to help us to debug and detect the state of the program running.
2.Data Visualization
Download the shape file from the official website and Use GEOpandas to create a map with the shape file. Each county is a GEOFIPS object which is defined in GEOPANDAS. Merge the each county in the map with its covid-19 case number. mapping the data into a list to get its corresponding color in the color bar, in which the darkness of the color represent the number of the active covid-19 case. From this map, user can have a general idea about which parts of United State are effected by the Epidemi.

Traverse every csv files which is the generated from our crawler program to get history data of each state and append it in lists. Then draw a line graph of those data for each state.

3.Display Interface
We use pygame to display the generated map and chart. There are three pages in the display interface. The first page is map. The function we originally wanted to achieve was to click on the corresponding area on the map, and it would automatically jump to the next page to display the data of that area. But in actual operation, we found that the piTFT screen is too small. When we click on a region, we often get the data of the next location because the click point is too large, so we use the search function instead of the click function.
The second page is the search page, we can get the data by searching the name of the state we want to know. On this page, we need to click to select the search box. When the search box turns from light blue to dark blue, enter the name of the state you want to search through the keyboard and click the Enter key. The page will automatically jump to the third page.
We can show the number of new cases today, the number of deaths, and the overall number of recoveries. Click the history button, we can get the history data of the last 7 days. Click the return button, we can return to the previous page and further search for the names of other states.
Logic Frame

Issues & resolution
1.Package install:
One of the biggest problems we met is the package install problem. Some packages can only be installed by the pip and some packages need to be installed using apt-get. And some packages need to install many dependencies.
So we did a conclusion about the command to install the package we need in this project. And for the library geopandas, we tried many approaches to install it but failed all the time. So we run that program on our own laptop and use the SCP to transfer it to the Raspberry Pi.
| pandas | sudo apt-get install python3-pandas | |
|---|---|---|
| datautil | sudo pip3 install --upgrade python-dateutil | use "sudo" |
| matplotlib | python3 -m pip install -U matplotlib | need install dependence below first |
| gi-3.2.2-2 | sudo apt-get install python-gi-3.2.2.2-2 | |
| gcc-4.7-base | sudo apt-get install gcc-4.7-base | |
| libgfortran3 | sudo apt-get install libgfortran3 | |
| libatlas3-base | sudo apt-get install libatlas3-base | |
| libatlas-base-dev | sudo apt-get install libatlas-base-dev |
2.Wrong coordinate::
Finally, all our codes are completed and tested on the monitor. The results are also very correct. However, when we want our code to run on the pi, there are some problems. Using sudo, the code cannot run on the pi. It can only be displayed on the monitor. Only after unplugging the cable connected to the monitor can you run on the pi. When pi is running, the coordinates obtained by PiFTF are messy. We are running the code in lab2, and the coordinates are also messy. This may be due to the professor’s suggestion. We restored the backup of lab2. Fortunately, the coordinates of the code in lab2 are successfully drop out it from the monitor to the piTFT and get the correct coordinate. But if we do not connect to the monitor and only run on the pi, the coordinate is still messy. The same is true for running the code of our final project. In reality, we tried all kinds of ways to run the code, such as connecting the HDMI cable to display on the monitor, displaying on PiTFT, SSH remote controlling, and displaying on piTFT without HDMI cable, and the result is only displaying it on the monitor can run correctly.
After continuous testing, we found the reason:
The code in lab2 cannot get the correct coordinate value when there is no HDMI connection, because when the pi is connected to the monitor, the monitor is the fb0 end, and the pi is the fb1 end. When there is no monitor, pi is the fb0 port, but in the code, it is the fb1 port, and pi cannot find the fb1 port, so when running on the pi, the coordinates are confused.
However, when we run the code of the final project, the coordinates are still incorrect. Under the professor's suggestion, we wrote a simple pygame code but still imported all the packages, commented on one imported code in turn, and run the program. Eventually, we found that the problem appeared in another file we imported. In this program, we mistakenly placed the init function of pygame in front of the os environment setting, and in the main program, because pygame was already initialized when importing the code, pygame will not be initialized again. As a result, the environment variables we set will not be applied in the program, so the obtained coordinates are always wrong.
In brief, if the coordinate is messed up, there are three things we need to check:
| 1.run the bash script ./fix_touchscreen |
| 2.check the os environment variables settings |
| 3.check the position of the pygame initializing |
Conlusion
In our initial design, we wanted to achieve a better way of human-computer interaction by clicking the corresponding location on the map to display the covid data of the corresponding location, but because the piTFT screen was too small, we switched to the search function. To replace the click function. In addition, when we realized the data visualization, we used the geopandas library to generate maps that reflect the epidemics in various parts of the United States, and use different colors to correspond to the number of people infected with different epidemics. But when we installed geopandas on the Raspberry Pi, due to the version limitation of the Raspberry Pi, we tried a variety of methods but failed but gave up. We enabled the backup plan and used the scp command to transfer the generated map from our personal computer.
For other functions, we have perfectly realized the original idea. Raspberry Pi can automatically crawl the data in the target website every hour, and store it locally with the date name, and further call these data to generate maps, line graphs, and obtain specific data to achieve data visualization. What's more, we also use pygame to design a user-friendly display interface to display the result of the crawler and data visualization. Our covid-tracker system combines software and hardware with a friendly interface design, which allows people to save time when browsing and searching web pages. At the same time, due to the portability and low consumption of the Raspberry Pi, it greatly facilitates people’s lives and it is also environment-friendly.
Finally, we would like to thank Professor Joe Skovira and the teaching assistants for giving us so much guidance, help, and advice. Whenever we encountered difficulties, they were always very kind and patient. Without their help, our final project would not have been so successful, and we would not be able to acquire so much knowledge just by relying on the two of us.
Future Work
Because PiTFT is too small, we give up the function of clicking on the map location to jump. We want to further try to realize this function, by zooming in part to click precisely, and then realizing the jump. And we can also to make the page more beautiful by adding some decorative elements. In addtion, when we do the test, because the scale of the button is too small, it is a little bit difficult to click precisely, we can design the interface in a more user-friendly way. At the same time, in the future, we will design a front-end web page to display the crawled data and add more interactive functions.
Another function we can optimize is the search funciton. Now we can only search for a fixed name. For example, if the users want to search for NewYork, they can only enter the full name. We can continue to improve it by allowing users to enter the abbreviation, initials, and search regardless of case of the county they want to know.
And we should also solve a potential problem, the storage capacity of the Raspberry Pi is full. We can periodically delete the previously stored csv files through cron so that the Raspberry Pi has enough space to store the new files that are constantly generated, which contributes to the system running more Stable and durable. We can also set a pop-up window to remind the user to delete it manually when it detects that the system memory is insufficient.
Work Distribution

Suhui Yu
sy466@cornell.edu
Crawler design, Display Interface design and Testing

Yanan Liu
yl2248@cornell.edu
Crawler design, data visualization and Testing
Parts List
- Raspberry Pi $35.00
Code Appendix
Please visit our github: 5725_final_project